
Short answer. A plant needs sustainability and ESG data because energy is a cost line, because customers, banks and insurers increasingly ask suppliers for energy, emissions and safety figures, and because regulation is moving the same way. It is cheaper to collect when it shares data with maintenance: the energy meters and motor currents that warn you about a failing machine also give the energy and CO2e numbers. One system means one set of sensors, one history and one audit trail, instead of a second project run from spreadsheets.
Sustainability often arrives at a plant as a questionnaire from a large customer or a bank: "send us your energy use and emissions for last year". The people who can answer are the same people who run the machines, and they already have sensors. The question is whether the answer takes a day or a quarter.
What ESG means in a plant
- E, environmental: energy, fuel, emissions (CO2e), water, waste.
- S, social: safety (injury rate), training hours, working conditions.
- G, governance: audits passed, policies, traceability of records.
In a plant the E part is the one that can be measured automatically. S and G are usually entered by people, but they should sit next to the same plant, the same period and the same history.
Why it matters
- Energy is a cost. Every kilowatt-hour that does not make a product, such as an idle machine, a leak or a motor working harder than it should, is money. Measuring is the first step to reducing.
- Customers, banks and insurers ask. Large buyers collect data from suppliers for their own reports, and lenders and insurers increasingly look at the same figures. A supplier who answers quickly and with evidence is easier to choose.
- Regulation moves in the same direction. The rules differ by country and change often, so check which apply to you; the common thread is more reporting of energy and emissions, and more questions from larger companies down the supply chain.
- Safety and reputation. Injury and training records are part of the same picture and are asked for in tenders and audits.
Where it usually goes wrong
Plants often start sustainability as a separate project: someone reads the meters once a quarter, types the numbers into a spreadsheet and multiplies by a factor found online. The result is a number nobody fully trusts, with no link to what the machines were doing. Three problems repeat:
- No history. You know the total, not when or why it changed.
- Unclear scope. Emissions are grouped by where they arise: scope 1 is fuel burned on site, scope 2 is purchased electricity, scope 3 is everything in the value chain. Mixing them makes the figure hard to defend.
- Factors from nowhere. The emission factor (kg CO2e per kWh, per cubic metre of gas) must come from your utility or a national inventory for your year and region.
Why maintenance and ESG share the data
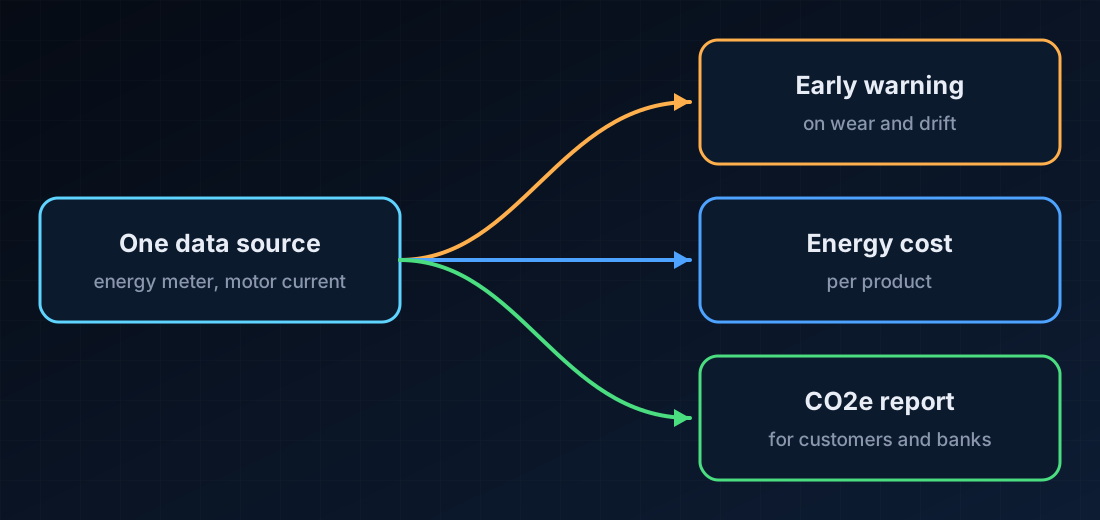
A machine that is wearing, misaligned or running with a leak usually consumes more energy for the same output, so the signal that tells maintenance something is wrong is often the same signal that tells you the energy per product is rising. (How to read those signals: vibration, temperature, current.) An unplanned stop also wastes energy: a restart, scrap and rework. Moving from repair-after-failure to planned work is therefore good for uptime and for the footprint at the same time. (See preventive vs predictive maintenance and what an unplanned stop really costs.)
| What you want to know | Where the data comes from | Who uses it |
|---|---|---|
| Energy per machine and per product | energy meters, motor current, production count | plant manager, finance |
| CO2e by source and scope | the same meters times your emission factors | sustainability lead, customers, banks |
| Early warning of wear that wastes energy | vibration, temperature, current trends | maintenance |
| Safety and training records | entered by the responsible people | HSE, auditors |
What our platform does, and what it does not
It does:
- links a sensor (for example an energy meter) to an emission factor and calculates CO2e for a period, with a breakdown by source and scope;
- shows CO2e per unit of product when you enter the production quantity;
- lets you try "what if" changes, such as a cleaner energy source or lower consumption, using your own measured consumption and your own factors;
- gives an overview across several plants, and exports a sustainability report to Excel;
- keeps Social and Governance figures (injury rate, training hours, audits) as manual entries next to the carbon data;
- shows the change in energy and CO2e next to maintenance results on one screen, and lets you build your own KPI that mixes sensor readings, carbon, alerts and ESG metrics;
- uses the same access rules and the same tamper-evident audit log as the rest of the platform.
It does not:
- replace an audited greenhouse-gas inventory or a certification. The emission factors that ship with the system are illustrative; you must replace them with your utility's or your country's figures;
- cover the full set of reporting standards such as GRI or SASB: the Social and Governance part is deliberately light;
- fix poor data: the figures are only as good as the meters and the factors behind them.
For a formal report that will be published or audited, involve a qualified consultant or auditor. What the platform gives you is the evidence and the history to put in front of them.
How to start this month
- List the energy meters you already have and the five machines that use the most energy.
- Get the emission factors from your utility or a national inventory, with the year and region written down.
- Link the meters to the factors and look at one month. Compare with your bills.
- Pick one machine where maintenance already watches current or temperature, and look at energy per product next to the warnings.
- Decide who enters the safety and training figures and how often.
Questions people ask
What is ESG reporting for a manufacturer? It is the collection and reporting of environmental figures (energy, emissions, waste), social figures (safety, training) and governance figures (audits, policies) about the plant, usually requested by customers, banks, insurers or regulators.
How do you calculate a factory's carbon footprint? Multiply measured consumption (kWh of electricity, cubic metres of gas, litres of fuel) by the emission factor for that source, and add the results by scope. The factors must come from your utility or a national inventory for your year and region.
Why track energy and maintenance in one system? The same sensors serve both: the signals that warn of a failing machine also show wasted energy, so one set of data gives early warnings, energy cost per product and the CO2e figures, with one history and one audit trail.
Does the platform make us compliant with a reporting standard? No. It gives you measured data, calculations with your own factors and exports. Compliance with a specific standard depends on the standard and on your auditor.
Next step
If you want to see this on your own meters and machines, you can request a pilot: five to seven weeks on three to five machines, with success criteria agreed before we start. Sustainability can be one of those criteria.